
Variance Formula: Population, Sample & Examples
The variance formula measures how far values typically spread from their mean by squaring each deviation and averaging those squared deviations. Use the population formula when your data is the complete group of interest, and use the sample formula with n − 1 when your data is a sample used to estimate a wider population. This guide shows both formulas, a worked example, frequency-table steps, Excel functions, the link to standard deviation, and the limits that matter when interpreting the result.

Variance formula at a glance
Population variance: σ² = Σ(x − μ)² ÷ N. Sample variance: s² = Σ(x − x̄)² ÷ (n − 1). In both formulas, subtract the correct mean from every value, square each difference, add the squares, and divide by the appropriate denominator.
Variance is a measure of spread, not a second average of the original values. Squaring makes every contribution non-negative and gives larger deviations more influence. The result is expressed in squared units: if the observations are in dollars, variance is in dollars squared; if they are in centimeters, variance is in square centimeters.
What variance measures
Start with a mean, which represents the center of the data. Each observation has a deviation from that center. A value close to the mean contributes a small squared deviation; a value far away contributes a much larger one. Averaging these squared deviations gives a single measure of how dispersed the data is around the center.
A small variance means the observations tend to cluster near the mean. A large variance means the observations are more spread out, or that a few distant values have a strong effect. Variance is useful for comparing variability when the data uses the same unit and scale, for describing uncertainty in a model, and for building other statistics such as standard deviation and standard error.
Variance does not tell you the direction of a change, the cause of a difference, or whether a value is practically important. Always inspect the original values, the unit, the sample design, and possible outliers beside the numeric result.
Population and sample variance formulas
Choose the denominator from the question, not from the size of the number you want to report. A population is the complete set you want to describe. A sample is only part of a larger population, so dividing by n − 1 corrects the usual downward bias when sample variance estimates population variance.
Population: σ² = [ (x₁ − μ)² + (x₂ − μ)² + … + (xN − μ)² ] ÷ N
Sample: s² = [ (x₁ − x̄)² + (x₂ − x̄)² + … + (xn − x̄)² ] ÷ (n − 1)
| Symbol | Meaning |
|---|---|
| x | One observed value |
| μ | Population mean |
| x̄ | Sample mean |
| N or n | Number of values in the population or sample |
| σ² or s² | Population or sample variance |
Some textbooks write the population variance as E[(X − μ)²], the expected squared distance from the mean. That notation describes the same idea for a random variable. For a finite data list, the step-by-step sum is usually easier to audit.
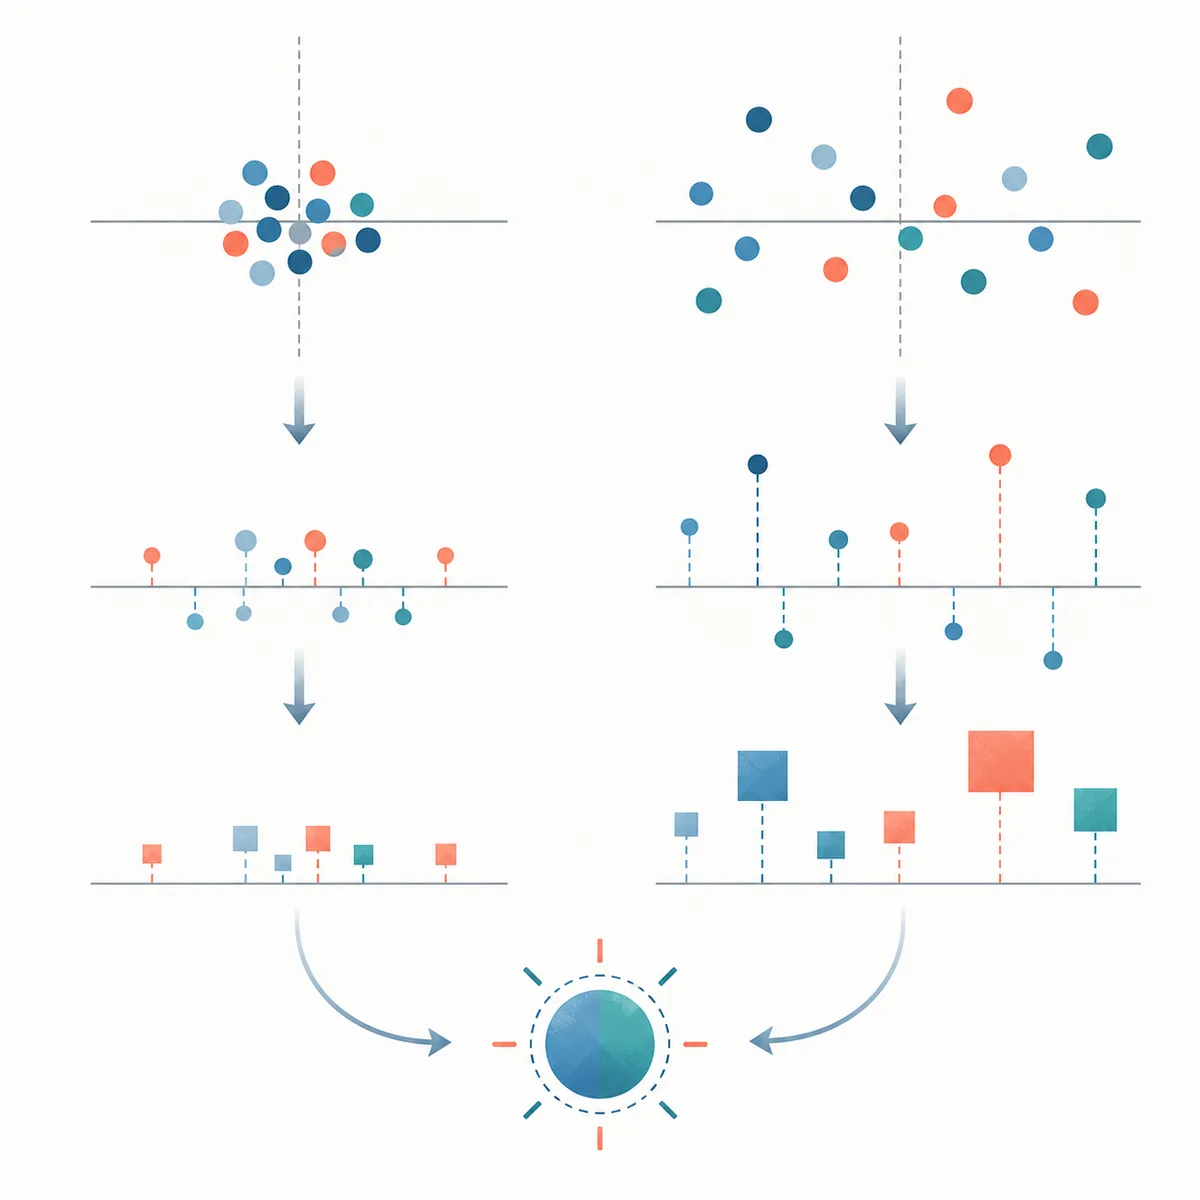
Worked variance example step by step
Use the sample data set 2, 4, 6, 8. It contains four observations, and we will treat it as a sample. The sample mean is (2 + 4 + 6 + 8) ÷ 4 = 5.
| Value x | Deviation x − x̄ | Squared deviation |
|---|---|---|
| 2 | −3 | 9 |
| 4 | −1 | 1 |
| 6 | 1 | 1 |
| 8 | 3 | 9 |
| Total | 0 | 20 |
The sum of squared deviations is 20. Because this is a sample, divide by n − 1 = 3: s² = 20 ÷ 3 ≈ 6.67. If the same four values were the entire population, divide by N = 4 instead: σ² = 20 ÷ 4 = 5. The arithmetic before the denominator is identical; the interpretation determines which denominator is correct.
Notice that the negative and positive deviations cancel before squaring, so simply averaging the unsquared deviations would always produce zero. Squaring preserves the size of the departure from the mean and is why variance captures spread.
Variance with frequency tables and grouped data
When a value occurs several times, use its frequency as a weight. For a population frequency table, the variance can be written as Σ[f(x − μ)²] ÷ Σf. First multiply each squared deviation by its frequency, add those weighted contributions, and divide by the total frequency. For a sample frequency table, the denominator is total frequency minus one when the table represents a sample.
For grouped intervals such as 10–19 or 20–29, the exact observations are unknown. A common approximation uses each interval midpoint as x, then applies the frequency-table formula. State that midpoint assumption in a report because the result is an estimate, not the exact variance of the hidden values.
Keep frequency, proportion, and measurement weights distinct. A proportion can be used as a normalized weight, while a frequency represents a count. The formula may look similar, but the denominator and the interpretation must match the data collection method.
Variance vs. standard deviation
Standard deviation is the square root of variance: σ = √σ² for a population and s = √s² for a sample. Variance is convenient for algebra, probability models, and decomposing sources of variation. Standard deviation is easier to explain because it returns to the original unit. A sample variance of 6.67 for measurements in centimeters corresponds to a sample standard deviation of about 2.58 centimeters.
Do not compare a variance in meters squared with a variance in centimeters squared without converting units first. For the same data, changing the measurement unit changes variance by the square of the conversion factor, while standard deviation changes by the conversion factor itself. The site's coefficient of variation formula guide explains how standard deviation can also be scaled by a mean for relative comparisons.
Variance formula in Excel and Google Sheets
Spreadsheet functions make the population-versus-sample choice explicit. If the values are in cells A2:A5, use =VAR.P(A2:A5) for population variance and =VAR.S(A2:A5) for sample variance in current Excel and Google Sheets versions.
=VAR.P(A2:A5)Sample:
=VAR.S(A2:A5)Older Excel workbooks may use VARP and VAR. Those names still appear in legacy files, but the newer VAR.P and VAR.S names make the intended denominator clearer. The Microsoft VAR.S reference documents the sample function and its behavior.
- Confirm that every cell contains a numeric observation and that blanks are intentional.
- Choose population or sample before copying the formula into a report.
- Keep units consistent and record any conversion or rounding.
- Compare the spreadsheet result with one hand-worked row to catch a shifted range.
Common mistakes and limits
The most frequent error is dividing by n when the data is a sample. The second is using the wrong mean, such as a mean calculated from a different subgroup. A third is forgetting that variance is squared-unit data and reporting it as if it were a typical distance.
- Population vs. sample: label the data source and select N or n − 1 accordingly.
- Outliers: squaring makes distant values influential, so inspect a box plot or the raw list before drawing conclusions.
- Mixed units: convert meters, centimeters, dollars, or percentages to a common unit first.
- Very small samples: sample variance can be unstable when n is small; show the sample size with the result.
- Grouped estimates: midpoint-based variance hides within-group spread and should be described as approximate.
- Rounding: retain precision in the mean and squared deviations, then round the final variance.
FAQ: variance formula
What is the variance formula in simple terms?
Find the mean, subtract it from every value, square each difference, add the squares, and divide by N for a population or n − 1 for a sample.
Why does sample variance use n − 1?
A sample mean is estimated from the same observations, which makes the squared spread around that mean slightly low on average. Dividing by n − 1, often called the degrees-of-freedom correction, gives a less biased estimate of population variance.
Can variance be negative?
No. Each squared deviation is zero or positive, so variance cannot be negative. A negative spreadsheet result usually indicates a different statistic, a formula error, or a display issue.
What is the difference between variance and standard deviation?
Standard deviation is the square root of variance and uses the original measurement unit. Variance uses squared units and is often more convenient for mathematical calculations.
Which Excel function calculates sample variance?
Use VAR.S(range) for sample variance. Use VAR.P(range) when the range contains the full population you want to describe.
How do I calculate variance from a frequency table?
Use each frequency as a weight: multiply every squared deviation by its frequency, add the weighted values, and divide by total frequency for a population or total frequency minus one for a sample.
Does a larger variance always mean worse data?
No. A larger variance means more spread on the chosen scale. Whether that spread is useful, risky, or expected depends on the measurement, the process, and the decision being made.
Summary
The variance formula averages squared distances from a mean. Use σ² = Σ(x − μ)² ÷ N for a complete population and s² = Σ(x − x̄)² ÷ (n − 1) for a sample. Show the mean, squared-deviation total, denominator, unit, and sample size so another reader can reproduce the result. When a result needs to be explained in the original unit, take the square root and report standard deviation alongside variance.
For related formula guides, compare the site's mean, median, and mode formulas, weighted average formula, and the Japanese standard deviation calculator. The calculation guides page lists more practical examples.
Reference links
For additional explanations of the same statistical ideas, see the GeeksforGeeks variance overview, the Math Is Fun standard deviation and variance explanation, and the Microsoft VAR.S function reference. These links explain general formulas; apply the population or sample rule that matches your own data collection.