
Coefficient of Variation Formula: How to Calculate CV
The coefficient of variation formula compares a standard deviation with its mean, then expresses the ratio as a percentage. For a population, divide the population standard deviation by the population mean. For a sample, divide the sample standard deviation by the sample mean. This relative measure helps compare spread when groups have different averages, but it is meaningful only when the data has a sensible zero and the mean is not zero or close to zero.
Coefficient of variation formula at a glance
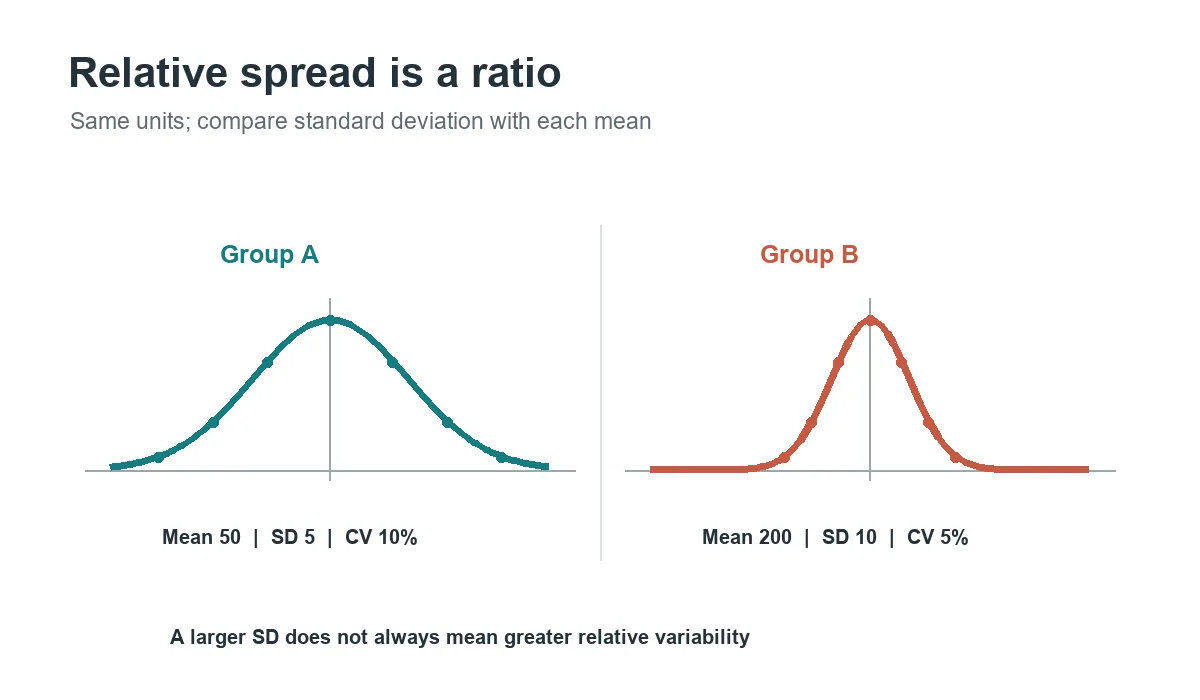
Coefficient of variation = standard deviation ÷ mean × 100%. Match the standard deviation and mean to the same population or sample. For example, a mean of 50 and a standard deviation of 5 give a CV of 10%.
The coefficient of variation, often shortened to CV, is also called relative standard deviation in some fields. It has no measurement unit because the numerator and denominator use the same unit. Multiplying by 100 presents the result as a percent, which is usually easier to compare.
What the coefficient of variation measures
Standard deviation reports spread in the original units: dollars, kilograms, seconds, or another measurement. That is useful when groups share a similar scale. It is less helpful when their means differ greatly. A standard deviation of 10 may be small around a mean of 500 but large around a mean of 20.
The coefficient of variation puts spread in relation to the average. A CV of 10% means the standard deviation is one tenth of the mean under the chosen convention. A higher CV indicates more relative dispersion, while a lower CV indicates values are more tightly grouped relative to their average. It does not tell you whether a result is good, bad, or statistically significant.
Because it is a ratio, the CV does not change when every value is converted by multiplying by a constant, such as kilograms to grams. The comparison still needs compatible measurements and a meaningful ratio scale. Do not compare unrelated variables just because both results are percentages.
Population and sample coefficient of variation formulas
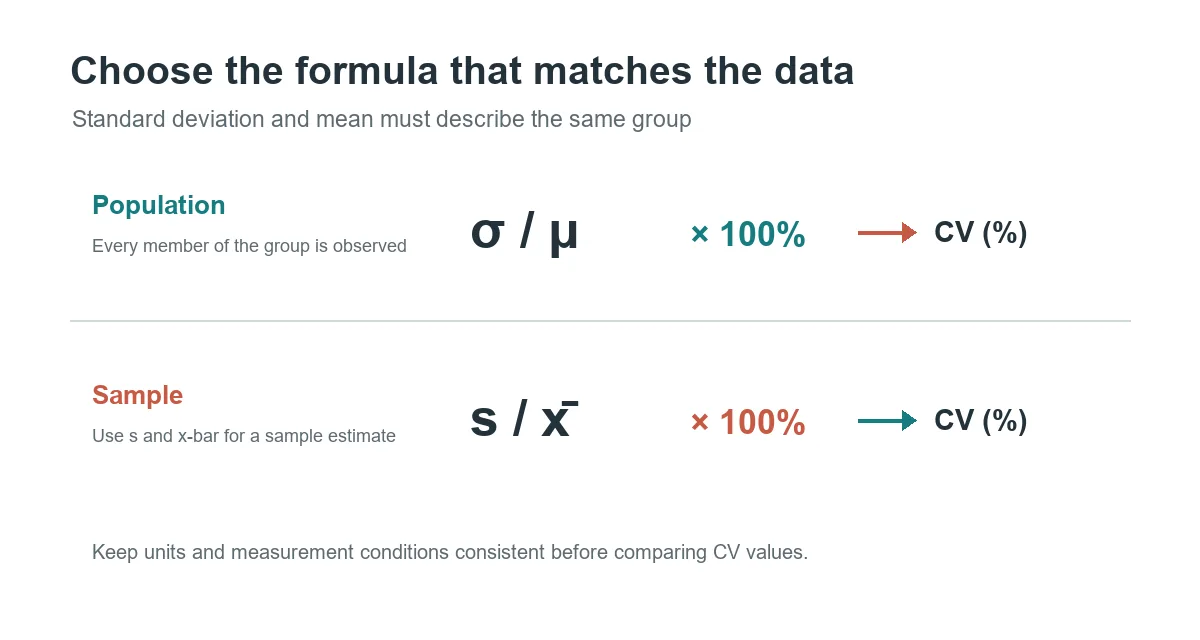
Choose the formula based on how the data was collected. If the values include every member of the population being described, use the population standard deviation and population mean. If the data is a sample used to estimate a larger population, use the sample standard deviation and sample mean.
Population CV: CV = population standard deviation ÷ population mean × 100%.
Sample CV: CV = sample standard deviation ÷ sample mean × 100%.
In symbols, the population formula is σ ÷ μ × 100%, where σ is the population standard deviation and μ is the population mean. The sample formula is s ÷ x-bar × 100%, where s is the sample standard deviation and x-bar is the sample mean. The sample standard deviation commonly uses n − 1 in its variance calculation; that correction is part of calculating s, not an extra adjustment to the CV formula.
Some references report the raw ratio, such as 0.10, while others multiply it by 100 and report 10%. The calculation is the same. State whether your result is a ratio or a percentage so that readers can compare it correctly.
Worked coefficient of variation examples
Compare relative spread across two means
Suppose Group A has a mean of 50 and a standard deviation of 5. Its coefficient of variation is 5 ÷ 50 × 100 = 10%. Group B has a mean of 200 and a standard deviation of 10. Its CV is 10 ÷ 200 × 100 = 5%.
| Group | Mean | Standard deviation | Calculation | CV |
|---|---|---|---|---|
| A | 50 | 5 | 5 ÷ 50 × 100 | 10% |
| B | 200 | 10 | 10 ÷ 200 × 100 | 5% |
Group B has the larger standard deviation in the original units, but its spread is smaller relative to its mean. This is the practical difference between absolute and relative variability. If both groups measure the same kind of quantity under compatible conditions, the CV makes the scale difference easier to interpret.
Calculate a sample CV by hand
For the sample values 2, 4, 6, and 8, the mean is 5. The squared deviations add to 20, so the sample variance is 20 ÷ (4 − 1) = 6.67 and the sample standard deviation is about 2.58. The sample coefficient of variation is 2.58 ÷ 5 × 100, or about 51.6%. If those four values represented the entire population instead, the population variance would be 20 ÷ 4 = 5, giving a population CV of about 44.7%.
Keep rounding until the final step when possible. Rounding the standard deviation too early can change a small CV comparison, especially when the groups are close.
Calculate the CV formula in Excel
If sample observations are in cells A2 through A11, use the sample standard deviation with the sample mean:
=STDEV.S(A2:A11)/AVERAGE(A2:A11)*100For data that contains every member of the population, use STDEV.P instead:
=STDEV.P(A2:A11)/AVERAGE(A2:A11)*100Format the result as a number with a percent sign if the formula already multiplies by 100. Alternatively, remove *100 and apply Excel's percentage format; do not do both, or the displayed value will be 100 times too large. Check that the cells contain numeric values and that the average is not zero.
When the coefficient of variation is useful
Use CV when the question is about consistency relative to a positive average, rather than the size of fluctuations in the original unit. It can help compare repeated production measurements, laboratory precision, demand relative to average sales, or time variation relative to an average duration. In each case, the measurements should describe the same underlying kind of quantity.
CV can also help when two groups have different means but use a meaningful zero. It gives a compact way to compare relative variability across those groups. Pair it with the mean and standard deviation, however, so readers can see both the scale and the absolute amount of spread.
There is no universal CV threshold that defines “consistent.” A 5% CV may be acceptable for one process and unacceptable for another. Set any pass/fail threshold from the domain's standards, measurement precision, and decision costs rather than treating a generic percentage as a rule.
Limitations and common CV mistakes
A zero or near-zero mean
The coefficient of variation formula divides by the mean, so it is undefined when the mean is zero. If the mean is very close to zero, even a modest standard deviation can produce an enormous and unstable percentage. In that situation, report the standard deviation or another scale-appropriate measure instead.
Negative means and arbitrary zero points
A negative mean produces a negative ratio under the direct formula. Some fields use the absolute mean by convention, while other fields consider CV inappropriate for such data. Do not silently take an absolute value. State the convention and confirm that it makes sense for the measurement. Temperature in Celsius is a common warning: zero Celsius is not an absence of temperature, so the CV changes if the same observations are converted to Kelvin.
Skew, outliers, and small samples
CV uses the mean and standard deviation, both of which can be strongly affected by outliers and long tails. A small sample can also make the sample standard deviation uncertain. Inspect the data distribution and report the sample size. For skewed data, a median and interquartile range may describe typical spread more robustly, depending on the question.
Another common mistake is mixing population and sample inputs, or comparing CV values from different measurement procedures as if they were directly interchangeable. Match the numerator and denominator, document the calculation convention, and keep the underlying quantity comparable.
CV vs standard deviation and variance
Standard deviation describes typical distance from the mean in the data's original unit. Variance is the squared version of that spread. The coefficient of variation divides standard deviation by mean, so it expresses relative dispersion without a unit. Each measure answers a different question; CV does not replace the mean or the standard deviation.
Use the standard deviation when the amount of change itself matters, such as a difference of five seconds or five dollars. Use CV when proportional spread is the comparison of interest and the data supports a ratio. For background on standard deviation, see the site's standard deviation calculation guide. For a related average that accounts for different weights, read the weighted average formula guide.
The phrase “coefficient of variance” is sometimes used informally, but variance and standard deviation are not interchangeable in the CV numerator. The common coefficient of variation formula uses standard deviation divided by mean. Check the source's definition before comparing a reported metric with your own calculation.
Frequently asked questions
What is the coefficient of variation formula?
Divide a standard deviation by the matching mean and multiply by 100% to express the result as a percentage. Use population values for a full population or sample values for a sample estimate.
What does a 10% coefficient of variation mean?
It means the standard deviation is one tenth of the mean under the stated convention. Whether 10% is small or large depends on the field, the data shape, and the decision being made.
Can the coefficient of variation be greater than 100%?
Yes. A standard deviation larger than the mean produces a CV above 100%. That can occur in highly dispersed data, but it is also a prompt to check for a near-zero mean, skew, or outliers.
Is CV the same as standard deviation?
No. Standard deviation is measured in the original units. CV is a dimensionless ratio of standard deviation to mean, commonly displayed as a percentage.
Can I calculate CV when the mean is negative?
The direct formula returns a negative ratio, and a near-zero mean can make it unstable. Some disciplines define a modified convention, but there is no universal adjustment. Verify the domain's method before reporting or comparing it.
Summary
The coefficient of variation formula is standard deviation divided by mean, multiplied by 100 when a percent is preferred. Use matching population or sample inputs, compare compatible ratio-scale measurements, and interpret the percentage alongside the mean and standard deviation. Avoid CV for zero or near-zero means, arbitrary-zero scales, or data where outliers make the mean misleading.