
Weighted Average Formula: How to Calculate It with Examples
The weighted average formula combines values with weights so that more important, more frequent, or larger groups influence the result more strongly. Multiply each value by its weight, add those products, and divide by the sum of the weights. For example, scores of 80, 90, and 70 with weights of 20%, 30%, and 50% produce a weighted average of 78. This guide explains the formula, worked examples, Excel and Google Sheets steps, and the mistakes that make a weighted result misleading.
Weighted average formula at a glance
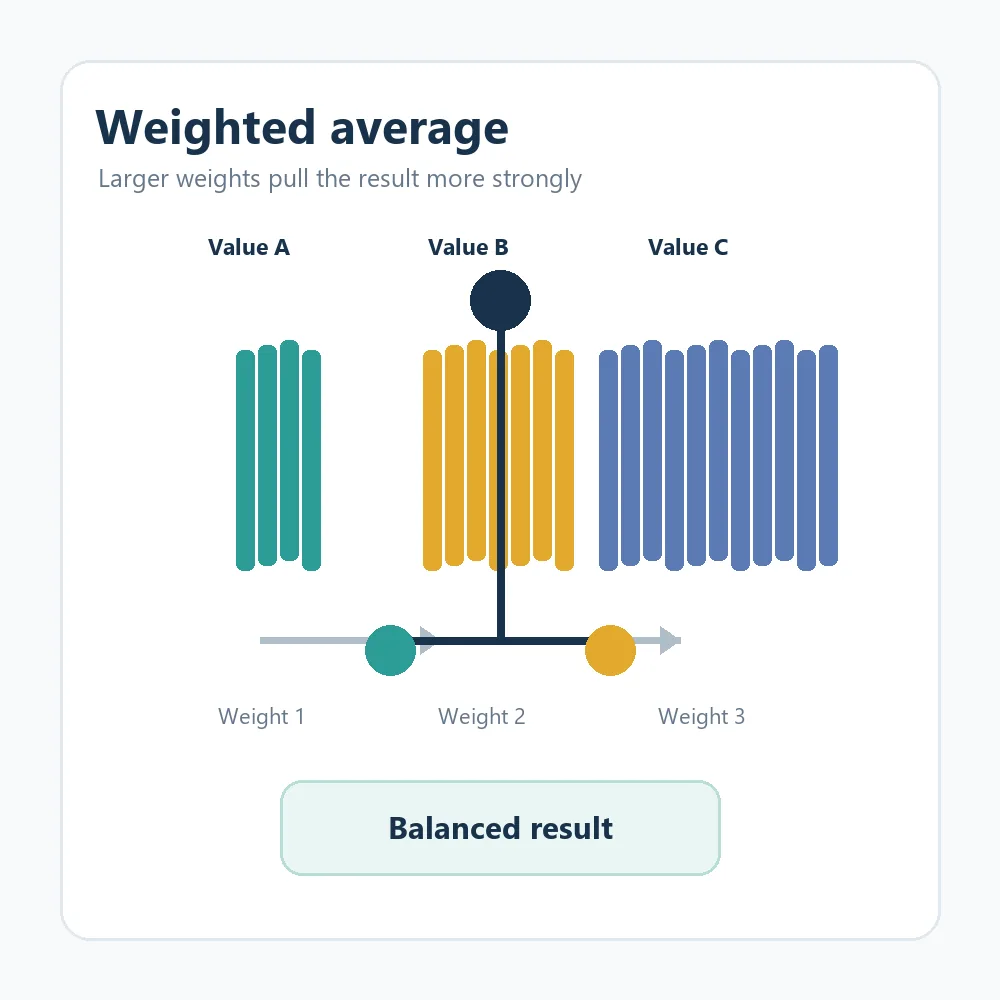
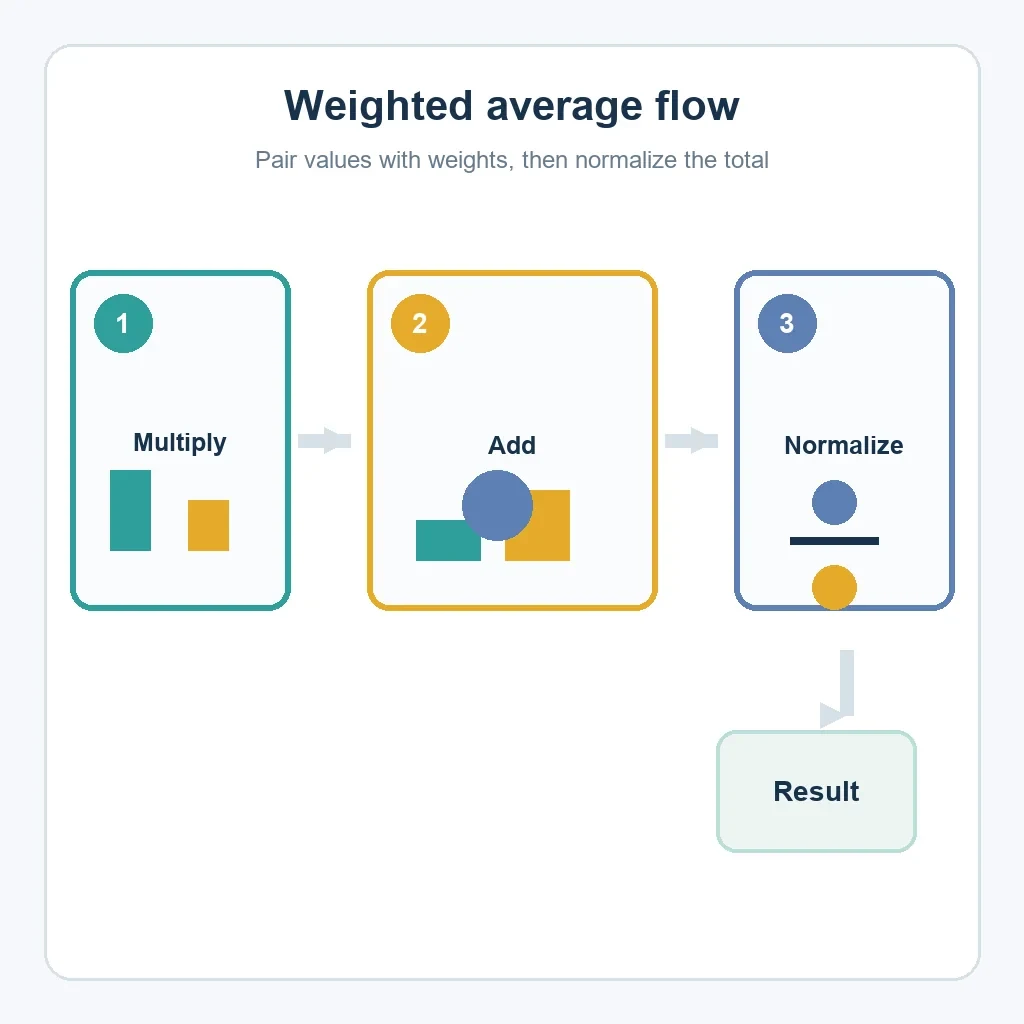
Weighted average = Σ(value × weight) ÷ Σ(weight). Multiply every value by its matching weight, add the products, then divide by the total weight. If the weights are percentages that add to 100%, use the percentages as decimals or use the same percentage scale in both the numerator and denominator.
The formula is useful when observations do not contribute equally. A final exam may count more than a quiz, a product bought ten times may matter more than a product bought once, and a survey group with more respondents should have more influence than a smaller group. The calculation preserves those differences instead of treating every row as equally important.
What a weighted average means
An ordinary average assumes every value has the same importance. Add the values and divide by how many values there are. A weighted average changes the influence of each value by attaching a weight that represents importance, frequency, quantity, time, or another stated basis.
The weight is not another score to average blindly. It explains how strongly a value should affect the result. A weight of 50% means that row contributes half of the total influence when all weights add to 100%. A frequency weight of 5 means the same value represents five observations. A quantity weight of 20 means the price or measurement applies to 20 units.
Before calculating, define what the weights mean and keep that definition consistent. Do not mix percentage weights, item counts, and hours unless they have been converted to a common basis. The arithmetic is the same, but the interpretation is different.
The weighted average formula and calculation steps
Use the same sequence for grades, prices, ratings, measurements, and grouped data. A table with a value column and a weight column is usually the clearest starting point.
- List each value: record the scores, prices, rates, or measurements with the same unit and definition.
- Record the matching weight: use the percentage, frequency, quantity, or importance assigned to that value.
- Calculate each product: multiply the value by its weight.
- Add the products: this is the weighted total in the numerator.
- Add the weights: use the total weight as the denominator.
- Divide and round at the end: keep enough precision to avoid changing the final result.
If the weights already add to 1, the denominator is 1 and the numerator is the result. If they add to 100, divide the weighted total by 100. When weights do not add to either value, the denominator in the formula normalizes them automatically, provided the total weight is not zero.
Worked weighted average examples
Example 1: course scores with different importance
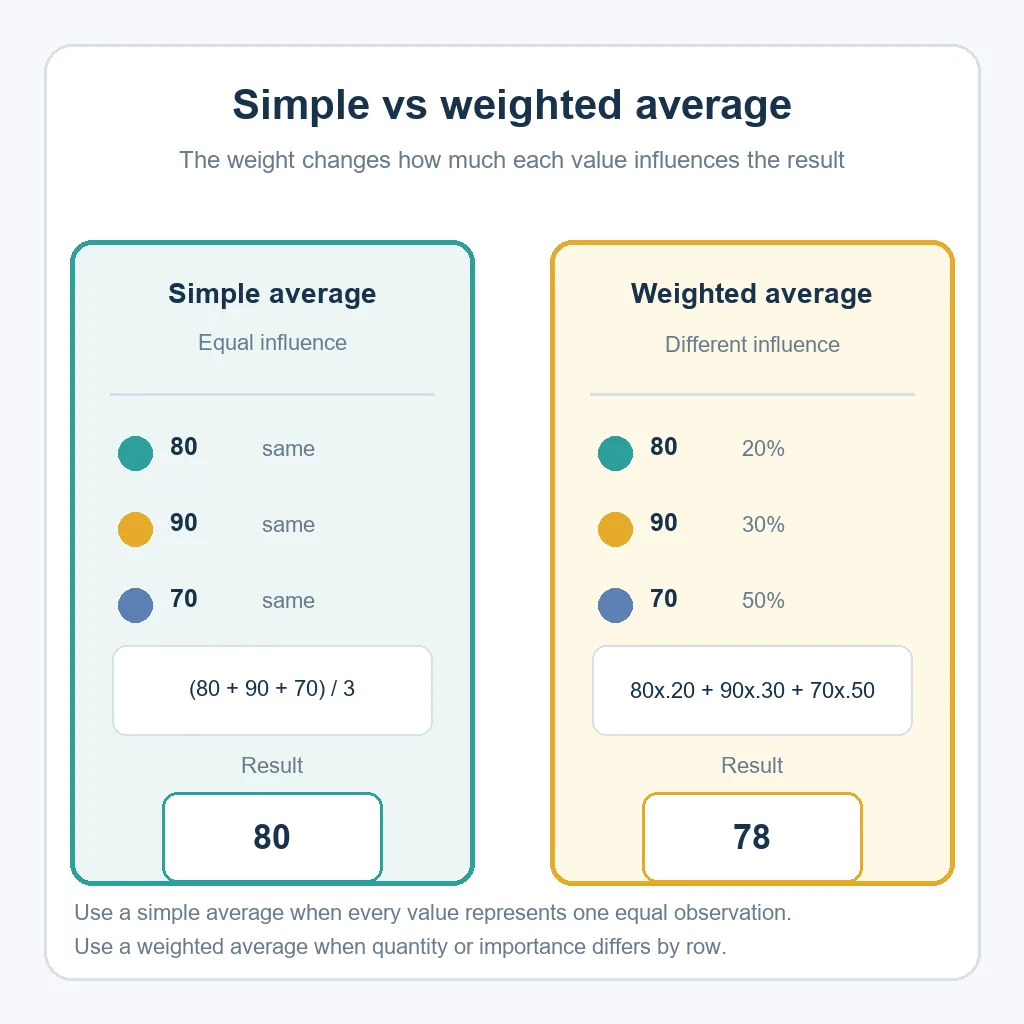
Suppose a course grade uses three components: an assignment score of 80 worth 20%, a midterm score of 90 worth 30%, and a final score of 70 worth 50%. The products are 16, 27, and 35. Add them to get 78. Because the weights add to 100%, the weighted average is 78.
| Value | Weight | Value × weight |
|---|---|---|
| 80 | 20% | 16 |
| 90 | 30% | 27 |
| 70 | 50% | 35 |
| Total | 100% | 78 |
Example 2: average price using purchase quantities
Imagine buying two items at $12, three items at $18, and five items at $15. The quantity is the weight because the higher-quantity price should influence the average more. The weighted total is $12 × 2 + $18 × 3 + $15 × 5 = $153. The total quantity is 10, so the weighted average price is $15.30 per item.
| Price | Quantity | Extended cost |
|---|---|---|
| $12 | 2 | $24 |
| $18 | 3 | $54 |
| $15 | 5 | $75 |
| Total | 10 | $153 |
The simple average of $12, $18, and $15 would be $15, but it ignores how many units were bought at each price. The weighted result of $15.30 answers the quantity-based question. This same pattern works for average cost, grouped survey results, and other repeated observations.
Weighted average vs. simple average
Use a simple average when each value represents one equally important observation. Use a weighted average when the rows represent different numbers of observations or have different importance. The choice is about the question being answered, not about which formula produces a more convenient number.
| Method | Best fit | Example |
|---|---|---|
| Simple average | Every value has equal influence | Average of three equally important tests |
| Weighted average | Values have different quantities or importance | Course grade with a final worth 50% |
| Weighted mean | Another name for a normalized weighted average | Mean of grouped observations using frequencies |
Do not confuse a general weighted average with a specialized accounting or market measure. Weighted average cost, weighted average cost of capital, and volume-weighted average price have their own definitions, inputs, and reporting conventions. Use the general formula only when it matches the meaning of the weights.
Weighted average in Excel or Google Sheets
Put the values in A2:A4 and their matching weights in B2:B4. The most reusable spreadsheet formula is:
SUMPRODUCT multiplies each value by the weight in the same row and adds the products. Dividing by SUM(B2:B4) keeps the formula correct whether the weights add to 1, 100, or another non-zero total. The values and weights must have the same number of rows.
Google Sheets provides AVERAGE.WEIGHTED for weighted calculations. The portable SUMPRODUCT formula keeps multiplication and normalization visible, while the Google Sheets function reference documents the function and its argument order.
- Label the columns clearly as Value and Weight.
- Check that each value is paired with the correct weight on the same row.
- Use
=SUM(B2:B4)in a check cell to inspect the total weight. - Use
=IF(SUM(B2:B4)=0,"N/A",SUMPRODUCT(A2:A4,B2:B4)/SUM(B2:B4))when empty or zero-weight input is possible. - Round only the displayed result, not the intermediate products, unless the reporting rule requires otherwise.
The same formula works in Google Sheets. If the weights are typed as percentages such as 20%, the spreadsheet stores them as decimals and the denominator still normalizes the result. If weights are counts such as 2, 3, and 5, the formula treats those counts as frequencies or quantities.
Common mistakes and edge cases
The most common error is using a simple average when the groups are not equal. A second error is multiplying a value by a percentage but forgetting to divide by the total weight when the weights are written as whole numbers. The general formula avoids that mistake.
- Zero total weight: the result is undefined because division by zero is not meaningful. Show N/A and correct the inputs.
- Different units: do not combine dollars, percentages, hours, or scores in one average without a clear conversion.
- Misaligned rows: a value paired with another row’s weight can produce a plausible but wrong result.
- Early rounding: keep full precision in the products and round the final display value.
- Negative or unusual weights: these may be valid in a specialized model, but they need a documented definition and should not be treated like ordinary frequencies.
If the result is being used for a grade, price, business report, or decision, show the inputs and weights beside the result. A single average without its weighting rule is difficult for another person to reproduce or challenge.
FAQ: weighted average formula
What is the simplest weighted average formula?
Multiply every value by its matching weight, add the products, and divide by the sum of the weights: Σ(value × weight) ÷ Σ(weight).
How do I calculate a weighted average with percentages?
Convert percentages to decimals or use the same percentage scale in the numerator and denominator. For 80 at 20%, 90 at 30%, and 70 at 50%, the result is 78.
What if the weights do not add to 100%?
Use the sum of the weights as the denominator. The formula normalizes weights that add to 1, 100, or another non-zero total. Check that the weights really represent the intended influence.
How do I calculate a weighted average in Excel?
With values in A2:A4 and weights in B2:B4, use =SUMPRODUCT(A2:A4,B2:B4)/SUM(B2:B4). Add an IF check when the total weight might be zero.
Does Google Sheets have a weighted average function?
Yes. Google Sheets includes AVERAGE.WEIGHTED. You can use SUMPRODUCT(values,weights)/SUM(weights) to keep normalization explicit.
Is a weighted average the same as a weighted mean?
In general usage, yes. Both describe an average in which values contribute according to weights. Specialized measures such as WAC or VWAP may use extra rules, so check the definition before applying the general formula.
When should I use a simple average instead?
Use a simple average when every value represents one equally important observation. If rows represent different quantities, frequencies, or importance levels, a weighted average is usually the better fit.
Summary
The weighted average formula is Σ(value × weight) ÷ Σ(weight). Define what each weight means, multiply matching values and weights, add the products, divide by the total weight, and round only after the calculation. Use a simple average only when every value has equal influence. For repeated work, SUMPRODUCT divided by the weight sum provides a clear Excel or Google Sheets implementation, while a visible input table makes the result easier to audit.
For related comparison concepts, see the site's percentage difference formula guide and month-over-month calculation guide. Return to the calculation guides for more formula explanations.