
Mean Median Mode: Formulas, Examples, and Differences
Mean median mode are three common ways to describe the center of a data set. The mean is the arithmetic average, the median is the middle value after sorting, and the mode is the value that occurs most often. This guide gives the mean median mode formulas, works through the same data set, and explains when an outlier makes the median more useful than the mean.
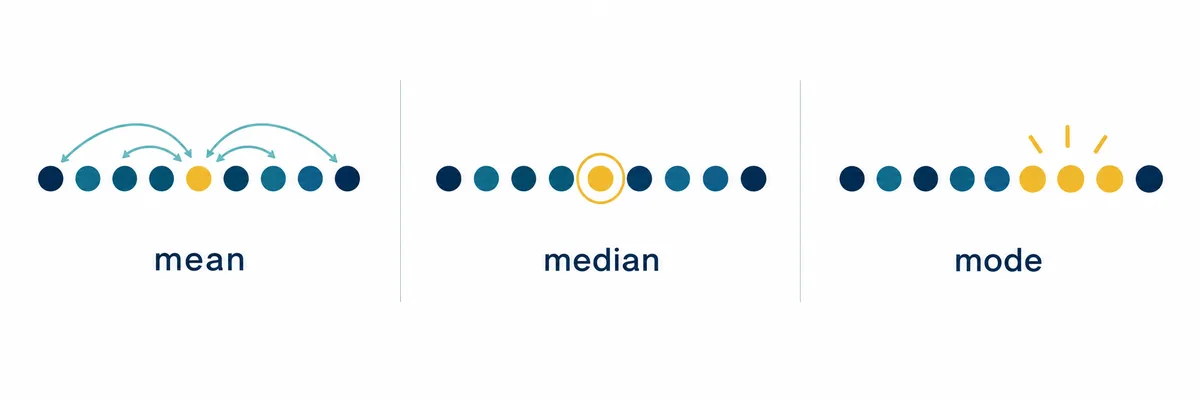
Mean median mode formula at a glance
Mean = sum of all values ÷ number of values. Median is the middle ordered value, or the average of the two middle values when the count is even. Mode is the most frequent value. A data set can have one mode, more than one mode, or no mode.
These measures are also called measures of center or central tendency. They answer related but different questions, so do not choose one only because its number is easiest to calculate. Check the shape of the data, the presence of outliers, and whether the values are numerical or categorical.
How to calculate the mean
The mean formula adds every numerical observation and divides the total by the number of observations. If the values are x1, x2, through xn, the formula is:
To calculate it, first count the values, then add them without skipping repeated entries, and finally divide. For 4, 6, 7, 9, and 10, the total is 36 and there are 5 values, so the mean is 36 ÷ 5 = 7.2. The mean uses every value, which makes it useful for balanced numerical data but sensitive to unusually large or small observations.
How to calculate the median
The median formula depends on the number of observations. Always sort the values from smallest to largest first. With an odd number of values, choose the single center position. With an even number, average the two center values:
| Number of values | Median rule | Example |
|---|---|---|
| Odd | Choose the middle position | 3, 5, 6, 8, 12 → 6 |
| Even | Average the two middle positions | 3, 5, 6, 8 → (5 + 6) ÷ 2 = 5.5 |
The median is based on order and position, not on the size of every gap. That is why a few extreme values usually move it less than they move the mean. It can be a better summary for income, home prices, response times, or other data with a long tail.
How to calculate the mode
The mode is the value with the highest frequency. Count how often each value appears and select the value or values with the largest count. For 2, 3, 3, 4, 5, 5, 5, and 8, the mode is 5 because it appears three times.
A set can be unimodal when one value is most common, bimodal when two values tie for the highest frequency, or multimodal when more values tie. If every value appears once, the data set has no mode. Unlike the mean and median, the mode can summarize categories such as the most common shirt size, color, or answer choice.
One data set, three answers
Use the ordered data set 4, 5, 5, 6, 7, 8, 8, 8, 12. Working from one list makes the difference between the three measures easier to see.
| Measure | Calculation | Result |
|---|---|---|
| Mean | (4 + 5 + 5 + 6 + 7 + 8 + 8 + 8 + 12) ÷ 9 | 7 |
| Median | The fifth value in the ordered list | 7 |
| Mode | 8 appears three times | 8 |
Here, the mean and median agree because the values are fairly balanced around 7, while the mode identifies the repeated value 8. The three results are not competing calculations; they provide different descriptions of the same distribution.
Outliers and skewed data
Consider 4, 5, 5, 6, 7, 8, and 60. The mean is 95 ÷ 7, or about 13.57, because the value 60 contributes heavily to the total. The median is 6, which stays near the center of the six ordinary values, and the mode is 5. Reporting only the mean could make a typical observation seem much higher than it is.
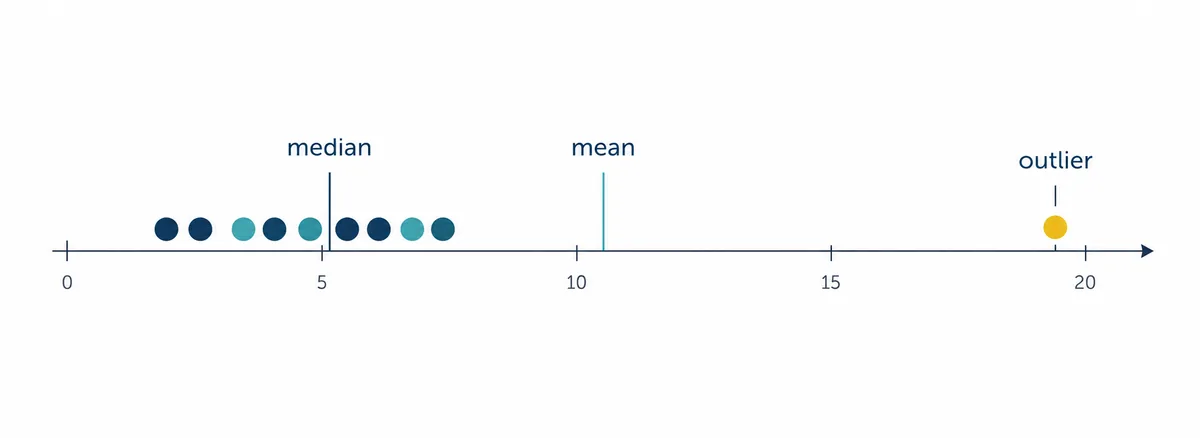
For a roughly symmetric distribution without extreme values, the mean is often informative. For skewed data, compare the mean and median and explain the difference. An outlier should not be deleted automatically: first check whether it is a data-entry error, a rare but valid observation, or evidence that the population contains different groups.
Which measure should you use?
| Measure | Good choice when | Watch for |
|---|---|---|
| Mean | Values are numerical and reasonably balanced | Outliers and long tails can pull it |
| Median | Data is ordered, skewed, or has extreme values | It does not use the size of every value |
| Mode | You need the most common value or a category | There may be ties or no repeated value |
In a report, it is often useful to show more than one measure. Pair a center with a spread measure such as range or standard deviation; the site’s standard deviation guide explains how variation is calculated. If observations have different importance or counts, compare the ordinary mean with the weighted average formula instead of silently treating every observation as equally important.
Frequency tables and grouped data
A frequency table lists each value and how many times it occurs. For the table below, the total number of observations is 10. The frequency-weighted total is 24, so the mean is 24 ÷ 10 = 2.4. The fourth and fifth ordered positions are both 3, making the median 3, and 3 is also the mode because it has the largest frequency.
| Value | Frequency | Value × frequency |
|---|---|---|
| 1 | 2 | 2 |
| 2 | 3 | 6 |
| 3 | 4 | 12 |
| 4 | 1 | 4 |
| Total | 10 | 24 |
For grouped intervals such as 10–19 or 20–29, the exact individual values are unknown. A grouped-data mean therefore uses class midpoints and is an estimate. State that limitation instead of presenting an estimate as if it were the exact mean.
Mean median mode in Excel and Google Sheets
If the data is in cells A2 through A10, common spreadsheet formulas are:
=AVERAGE(A2:A10)for the arithmetic mean.=MEDIAN(A2:A10)for the middle value or middle-pair average.=MODE.SNGL(A2:A10)in Excel for one mode; Google Sheets commonly uses=MODE(A2:A10).
Check whether blank cells, text, error values, or hidden filters are affecting the range. A mode function may return an error or a single value when several modes exist, so inspect the frequency counts when ties matter. Spreadsheet output is only as reliable as the range and data-cleaning choices behind it.
Common mistakes
- Forgetting to sort before finding the median: position has no meaning in an unsorted list.
- Dividing the mean by the wrong count: include every numerical entry, including repeated values.
- Assuming every set has a mode: a tie or no repetition is a valid result.
- Calling the median an average of all values: it uses the center position, not the full total.
- Ignoring outliers: compare mean and median before describing what is typical.
- Using a grouped estimate as an exact answer: state when class midpoints were used.
For a textbook explanation of measures of center, including mean, median, mode, frequency examples, and outliers, see OpenStax’s Measures of the Center of the Data.
FAQ: mean median mode
What is the difference between mean, median, and mode?
The mean is the arithmetic average, the median is the middle ordered value, and the mode is the most frequent value. They can produce different answers for the same data.
How do I find the median with an even number of values?
Sort the values, identify the two middle positions, add those two values, and divide by 2. For 3, 5, 6, and 8, the median is (5 + 6) ÷ 2 = 5.5.
Can a data set have two modes?
Yes. If two values tie for the highest frequency, the set is bimodal. If several values tie, it is multimodal. If no value repeats, there is no mode.
Which is better, mean or median?
Neither is always better. Use the mean for balanced numerical data and the median when outliers or skew make the average unrepresentative. Explain the reason for your choice.
Is mode useful for numerical data only?
No. Mode is especially useful for categorical data because it identifies the most common label, such as a color, size, response, or product category.
What is the mean median mode formula in Excel?
Use AVERAGE for the mean, MEDIAN for the median, and MODE.SNGL in Excel or MODE in Google Sheets for the most common value. Confirm the range and inspect ties.
Summary
Mean median mode are complementary measures of center. Add and divide for the mean, sort and find the center for the median, and count repetitions for the mode. Compare the three when the data is skewed, use the median cautiously with even counts, and state whether a frequency table or grouped estimate changed the calculation.