
Standard Error Formula: Mean, Sample, and Examples
The standard error formula estimates how much a sample statistic, especially a sample mean, would vary across repeated samples. For a sample mean, divide the sample standard deviation by the square root of the sample size: SE = s / √n. This article shows the arithmetic, explains why the square root matters, and connects the result to confidence intervals and spreadsheet formulas.
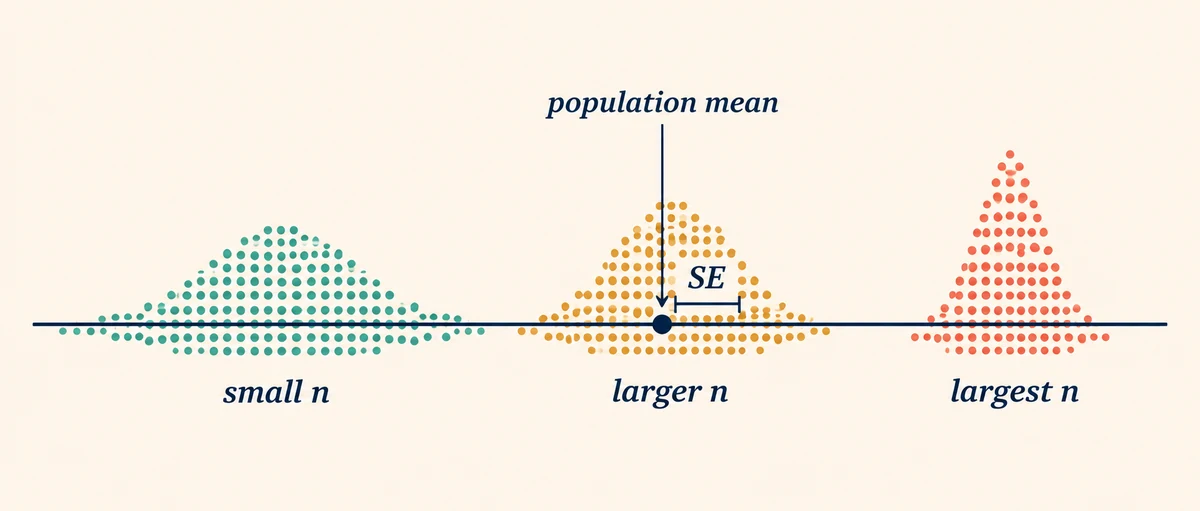
Standard error formula at a glance
Standard error of the mean = sample standard deviation ÷ √sample size.
In symbols, SE(x̄) = s / √n. If the population standard deviation σ is known, the theoretical form is SE(x̄) = σ / √n.
The formula has three parts: a measure of variation in the observations, a sample size, and a square root. A larger sample leaves the same amount of individual noise spread over more observations, so the uncertainty of the mean decreases. Doubling n does not halve the standard error; it multiplies it by 1/√2, about 0.707.
This topic is different from standard deviation. The site's standard deviation guide describes how far individual values spread from their mean. The standard error formula describes how a calculated mean varies as samples change.
What standard error measures
A sample is usually used to learn about a larger population. Imagine taking many random samples of the same size, calculating the mean of every sample, and plotting those means. The center of that sampling distribution is the population mean. Its spread is the standard error of the mean. A small standard error means that sample means tend to cluster closely; a large standard error means that the estimate is more variable.
Standard error is therefore about an estimate, not about every individual observation. A class can contain scores that are widely spread while the class average is estimated precisely when the sample is large. Conversely, a small sample can have a modest standard deviation but still produce a mean with noticeable sampling uncertainty.
Formula for the standard error of the mean
For a sample mean, use the sample standard deviation s and the number of observations n:
Estimated standard error: SE(x̄) = s / √n
Known-population form: SE(x̄) = σ / √n
The estimated form is used most often because σ is usually unknown. First calculate s with the sample standard deviation convention, which divides the squared deviations by n − 1. Then divide that result by √n. Do not divide the standard deviation by n itself, and do not subtract 1 again in the standard error step.
| Symbol | Meaning | Where it appears |
|---|---|---|
| x̄ | Sample mean | The statistic being estimated |
| s | Sample standard deviation | Measures variation in the observed sample |
| σ | Population standard deviation | Used when the population value is known |
| n | Number of observations | Controls how sampling uncertainty shrinks |
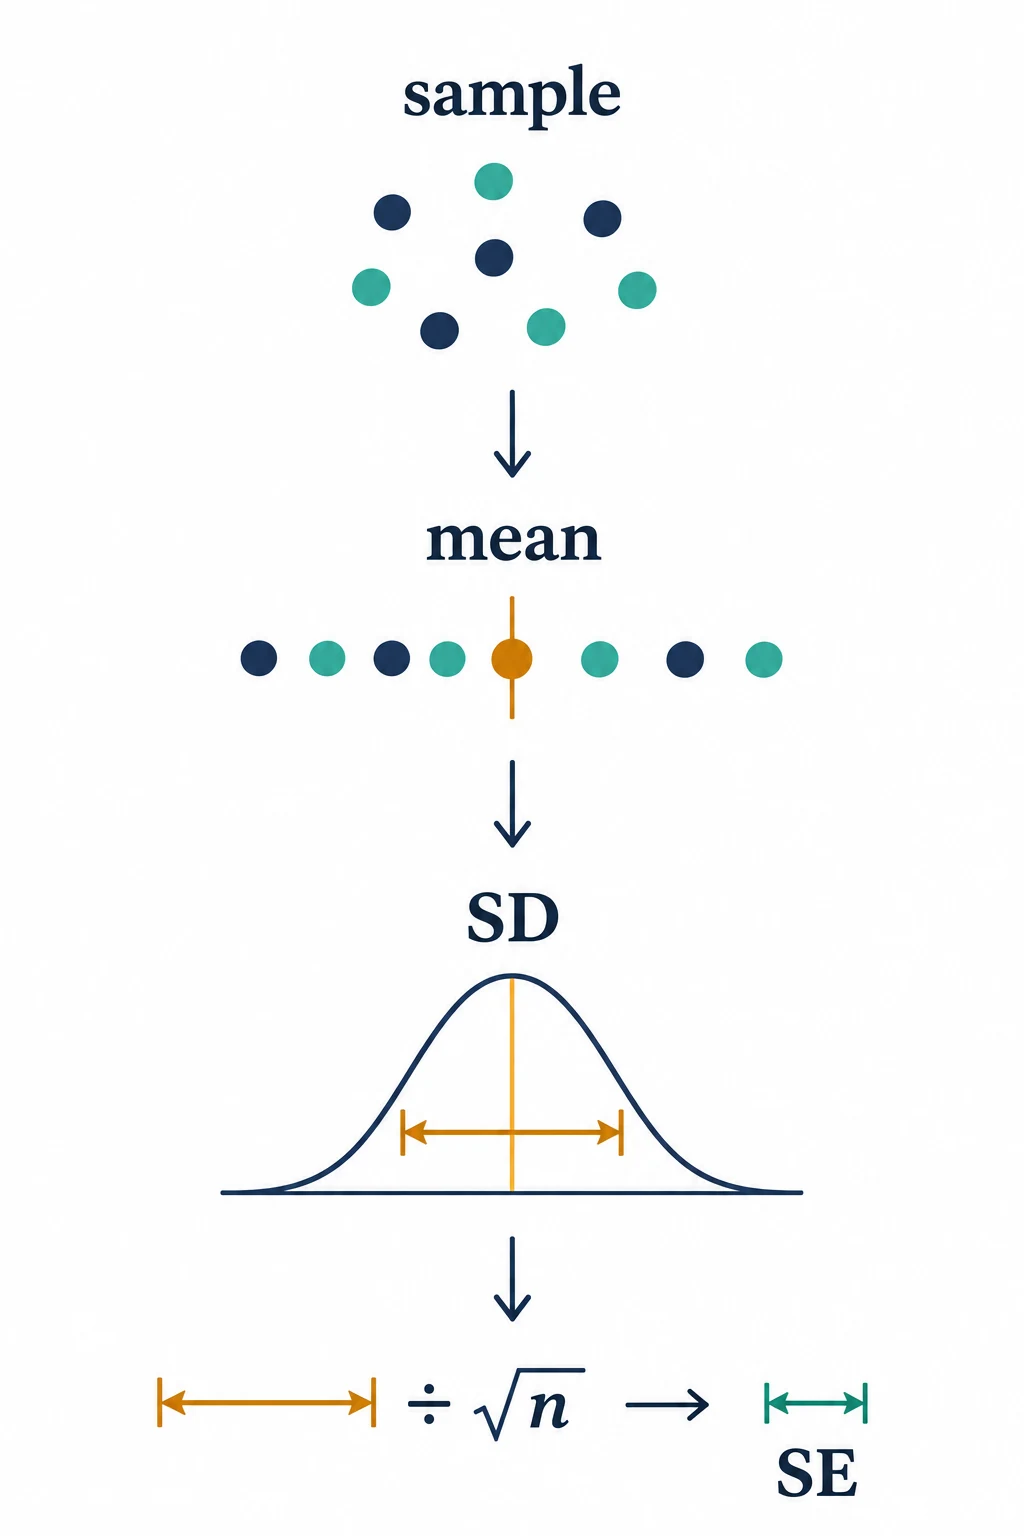
Worked example: calculate standard error step by step
Use the five sample values 4, 6, 8, 10, and 12. This small data set makes each part of the standard error formula visible.
- Find the sample mean: (4 + 6 + 8 + 10 + 12) ÷ 5 = 40 ÷ 5 = 8.
- Find each deviation: subtract 8 from every value, giving −4, −2, 0, 2, and 4.
- Square and add the deviations: 16 + 4 + 0 + 4 + 16 = 40.
- Calculate the sample standard deviation: s = √(40 ÷ (5 − 1)) = √10 ≈ 3.162.
- Apply the standard error formula: SE = 3.162 ÷ √5 ≈ 1.414.
| Value | Deviation from 8 | Squared deviation |
|---|---|---|
| 4 | −4 | 16 |
| 6 | −2 | 4 |
| 8 | 0 | 0 |
| 10 | 2 | 4 |
| 12 | 4 | 16 |
| Total | 40 |
The result does not say that each observation is within 1.414 units of the mean. It estimates the typical sampling variation of the mean under the sample assumptions. A population calculation would use a different standard deviation convention.
Standard error vs. standard deviation
These measures are related because the standard error formula uses a standard deviation, but they answer different questions. Standard deviation describes the spread of observed values. Standard error describes the spread of a statistic across repeated samples.
| Measure | Question answered | Effect of increasing n | Typical use |
|---|---|---|---|
| Standard deviation | How spread out are individual values? | May stay similar if the population is unchanged | Describe variation in the data |
| Standard error | How variable is the estimated mean? | Falls in proportion to 1/√n | Quantify precision and build intervals |
A common reporting mistake is to label a standard deviation as a standard error or to divide by n when a square root is required. Report the sample size and the chosen statistic next to the number. For related measures of spread, the variance formula guide explains why squared deviations come before the standard deviation.
Using standard error in confidence intervals
Standard error is the scale used for a confidence interval around a sample mean. A simplified form is:
For the worked sample, the mean is 8 and the standard error is about 1.414. With five observations and an unknown population standard deviation, a two-sided 95% interval commonly uses a t critical value with 4 degrees of freedom, about 2.776. The margin of error is approximately 2.776 × 1.414 = 3.925, giving an interval from about 4.08 to 11.92.
The critical value depends on confidence level, degrees of freedom, and the z or t distribution. State the confidence level and method when reporting the interval; it describes estimate precision, not the share of individual values inside the limits.
Standard error formula in Excel and Google Sheets
Suppose the sample observations are in cells B2:B6. The estimated standard error of the mean can be calculated directly with:
=STDEV.S(B2:B6)/SQRT(COUNT(B2:B6))STDEV.S supplies the sample standard deviation, while COUNT supplies the number of numeric observations. The same formula works in Google Sheets. If the cells contain every member of a known population and you intentionally use the population convention, replace STDEV.S with STDEV.P.
- Check that the range contains numeric observations only; text and blank cells can change the count.
- Keep the same range in both functions so the numerator and n describe the same sample.
- Do not format the result as a percentage unless the analysis calls for a relative standard error.
- Keep extra decimal places during the calculation and round the final value for display.
Assumptions, limits, and common mistakes
The standard error formula assumes a reasonably representative process and observations that are independent or close to independent. Repeated measurements, autocorrelated time-series values, or a convenience sample can make it misleading.
- Small or skewed samples: a sample standard deviation may not represent the population well, and a t-based interval can be wide.
- Dependence: clustered or repeated observations often contain less independent information than COUNT suggests.
- Outliers: one extreme value can inflate s and therefore inflate the standard error.
- Wrong denominator: use √n in the standard error step; n − 1 belongs inside the sample variance calculation.
- Confusing precision with spread: a small standard error does not mean the individual observations are tightly grouped.
- Premature rounding: round after the square-root and division steps, especially for small samples.
Frequently asked questions
What is the standard error formula for a sample mean?
Use SE(x̄) = s ÷ √n, where s is the sample standard deviation and n is the number of observations. If the population standard deviation is known, use σ ÷ √n instead.
How do I calculate standard error by hand?
Find the sample mean, calculate the sample standard deviation with n − 1 in the variance denominator, count the observations, and divide the standard deviation by √n.
Is standard error the same as standard deviation?
No. Standard deviation describes the spread of individual data values. Standard error describes the sampling uncertainty of a statistic such as the mean.
Why does standard error use the square root of n?
Independent random variation aggregates so that the variance of a mean shrinks with n. Taking the square root converts that variance relationship back to the original measurement unit, producing a 1/√n decrease.
Can standard error be larger than standard deviation?
For the usual sample-mean formula with n greater than 1, s ÷ √n is smaller than s. A reported value that is larger may use a different statistic, a different standard error definition, or an incorrect denominator.
What is the Excel formula for standard error?
For sample data in B2:B6, use =STDEV.S(B2:B6)/SQRT(COUNT(B2:B6)). Use STDEV.P only when the values represent the complete population under your chosen convention.
Summary
The standard error formula for a sample mean is SE = s / √n. Calculate the sample standard deviation first, divide by the square root of the sample size, and report the unit and assumptions. Standard error measures the precision of a mean across repeated samples; standard deviation measures spread among individual observations.
Use the result as the scale for a confidence interval, check the sample design before interpreting it, and verify spreadsheet ranges with a hand calculation. For the variance component used to obtain s, see the variance formula guide; for the mean itself, see the mean, median, and mode guide.