
Month over Month Calculation: Formula, Examples, and Excel Steps
The month over month calculation compares a current month with the immediately previous month. It is useful for checking changes in revenue, users, orders, expenses, or other recurring measures. The key is to show both the numerical difference and the percentage change, because a percentage without its previous-month base can be misleading.
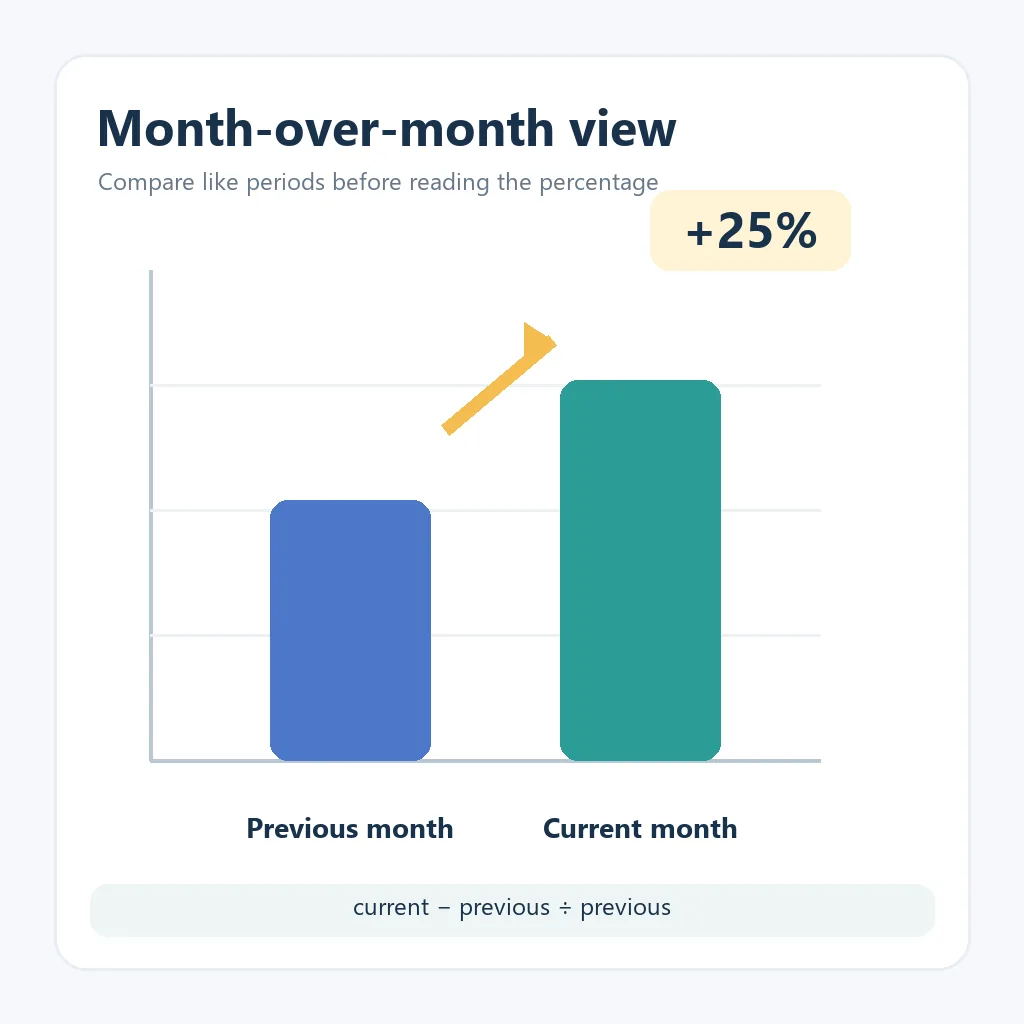
The month over month calculation formula
Month over month change (%) = (Current month − Previous month) ÷ Previous month × 100. If last month was 100 and this month is 125, the change is (125 − 100) ÷ 100 × 100 = 25%.
The same formula works for a rise, a fall, or no change. Use the previous month as the denominator, not the current month. The written result should also show the two input values so another person can reproduce the calculation.
What month over month means
Month over month, often shortened to MoM, is a short-term comparison between adjacent monthly periods. A sales team might compare April with March, while a product team might compare the number of active users in one month with the previous month. The periods should be defined consistently: calendar month with calendar month, billing month with billing month, or another clearly documented reporting period.
MoM is especially helpful when a business needs an early signal. It can reveal a sudden increase in demand, a drop after a campaign ends, a change in operating cost, or an unusual support workload. It is not a complete explanation of why a metric changed. The calculation describes the direction and size of the change; the surrounding business context explains the cause.
For a quick numerical result, use the existing month-over-month calculator. This article focuses on the formula, reporting choices, spreadsheet setup, and situations where the result needs extra care.
Month-over-month formula with worked examples
Start with the difference between the current value and the previous value. Divide that difference by the previous value, then multiply by 100 to express the result as a percentage. Keep the unrounded values during the calculation and round only the displayed result.
| Previous month | Current month | Difference | MoM change | Reading |
|---|---|---|---|---|
| 100 orders | 125 orders | +25 | +25% | Orders increased by one quarter. |
| $5,000 revenue | $4,000 revenue | −$1,000 | −20% | Revenue fell by one fifth. |
| 240 users | 240 users | 0 | 0% | No month-over-month change. |
| 80 tickets | 100 tickets | +20 | +25% | The workload grew relative to the base. |
For the revenue example, subtracting gives −1,000. Dividing −1,000 by 5,000 gives −0.20, so the month over month calculation is −20%. A negative sign indicates a decline; it does not automatically mean the result is bad. Lower expenses may be positive, while lower sales may need investigation.

How to calculate MoM in Excel or Google Sheets
A spreadsheet is useful when you need to repeat the month over month calculation for many products, channels, or months. Put the period labels in the first row, the previous month in one column, and the current month in the next column. For example, place the previous value in cell B2 and the current value in cell C2.
- Enter the previous-month value in
B2and the current-month value inC2. - In the result cell, enter
=(C2-B2)/B2. - Format the result cell as a percentage and choose the number of decimal places.
- Copy the formula down only after checking that every row uses the correct previous-month base.
If the sheet should show the numerical difference instead of the rate, use =C2-B2. If the previous value can be zero, wrap the formula in an error check such as =IF(B2=0,"N/A",(C2-B2)/B2). Choose a message that your team understands; showing a blank or zero can incorrectly suggest that a valid comparison was made.
When reporting multiple months, label the calculation clearly. “May MoM” should mean May compared with April, while “June MoM” should mean June compared with May. A consistent layout prevents a correct formula from being applied to the wrong pair of periods.
MoM versus percentage change, percentage points, and YoY
Several terms sound similar but answer different questions. Choosing the correct measure makes a report easier to audit and prevents an increase in a rate from being overstated.
| Measure | What it compares | Example use |
|---|---|---|
| Month over month | One month with the immediately previous month | May revenue versus April revenue |
| Percentage change | A general old value with a new value | Before and after a price change |
| Percentage-point change | Two percentages by subtraction | Conversion rate from 4% to 5% is +1 percentage point |
| Year over year | A period with the same period in the prior year | July this year versus July last year |
A conversion rate moving from 4% to 5% increased by 1 percentage point. Its relative percentage change is 25%, because (5% − 4%) ÷ 4% = 25%. Both statements can be mathematically correct, but they communicate different scales. For a longer seasonal business cycle, compare the same month in the previous year using the year-over-year calculation guide.
How to interpret a month-over-month result
A MoM result is a comparison signal, not a diagnosis. Read it together with the absolute difference, the size of the previous-month base, and the period definition. A change from 10 to 15 is +50%, but the absolute increase is only 5 units. A change from 10,000 to 10,500 is +5%, but the absolute increase is 500 units. Both views may matter to a decision-maker.
- Check the base: small previous values create large percentages from small numerical changes.
- Check comparability: a 28-day month and a 31-day month may not represent the same opportunity.
- Check calendar effects: holidays, paydays, campaigns, weather, and one-off events can move a monthly total.
- Check the denominator: revenue, expenses, users, and rates may need different explanations even with the same percentage.
- Check a longer view: use several months or a year-over-year comparison before describing a short change as a trend.
For a management report, a useful line often includes the current value, previous value, absolute difference, MoM rate, and one sentence of context. This is more informative than displaying a large percentage alone.
Zero, negative, and unusual previous-month values
If the previous month is zero, the standard month over month calculation divides by zero and has no finite percentage result. Do not force the output to 0% or 100%. Use “N/A,” “new,” or another documented label, and show the absolute current value separately. For example, moving from 0 to 40 new users is meaningful, but it is not a standard percentage change.
A negative previous value needs a written convention. Costs, profit, inventory adjustments, or accounting corrections can create negative numbers, and different teams may interpret the sign differently. Keep the raw values visible, state the formula used, and avoid describing the result as ordinary growth without context.
Also check missing values, refunds, restatements, partial-month data, and changes in tracking. If the data definition changed between periods, the arithmetic may be correct while the comparison is not comparable. A short note about the data boundary is part of a reliable report.
A practical MoM reporting checklist
- Define the metric and the exact start and end dates for both periods.
- Confirm that the previous-month and current-month values use the same data definition.
- Calculate the absolute difference first, then calculate the percentage.
- Check for a zero or negative denominator before publishing the rate.
- Show the inputs, formula, rounded result, and a short explanation of unusual movement.
- Compare the result with a longer trend or year-over-year view when seasonality matters.
Following the same order makes it easier to reproduce a result in a spreadsheet, a dashboard, or the month-over-month calculator. If you need a general change rate rather than adjacent monthly periods, the increase-rate calculator may be a better fit.
FAQ: month over month calculation
What is the simplest month over month calculation?
Subtract the previous-month value from the current-month value, divide by the previous-month value, and multiply by 100. The formula is (current − previous) ÷ previous × 100.
Is month over month the same as percentage change?
The arithmetic is the same when the old value is the previous month. “Month over month” describes the time relationship, while “percentage change” is the broader mathematical description.
How do I calculate MoM in Excel?
With the previous value in B2 and the current value in C2, enter =(C2-B2)/B2 and format the result as a percentage. Add a zero-denominator check when B2 may be zero.
Can a month over month result be negative?
Yes. A negative result means the current value is lower than the previous value. Interpret the direction together with the metric: lower costs may be helpful, while lower sales may require investigation.
What should I do when the previous month is zero?
Do not divide by zero or invent a percentage. Report the current value, label the percentage as N/A or new, and explain that there is no non-zero base for a standard MoM rate.
Summary
The month over month calculation is a simple way to compare adjacent monthly periods: (current − previous) ÷ previous × 100. A useful report adds the absolute difference, keeps the period definitions consistent, distinguishes percentage points from relative change, and flags zero or unusual bases. Use the formula in a spreadsheet for repeatable reporting, or open the site’s calculator when you need a quick check.