
Interquartile Range Formula: How to Find IQR
The interquartile range formula is IQR = Q3 − Q1: subtract the first quartile from the third quartile. First sort the data and choose a quartile method, then find the values at the 25th and 75th percentiles. The interquartile range describes the spread of the middle half of a data set and is less affected by extreme values than the full range. The same formula applies regardless of the quartile convention.
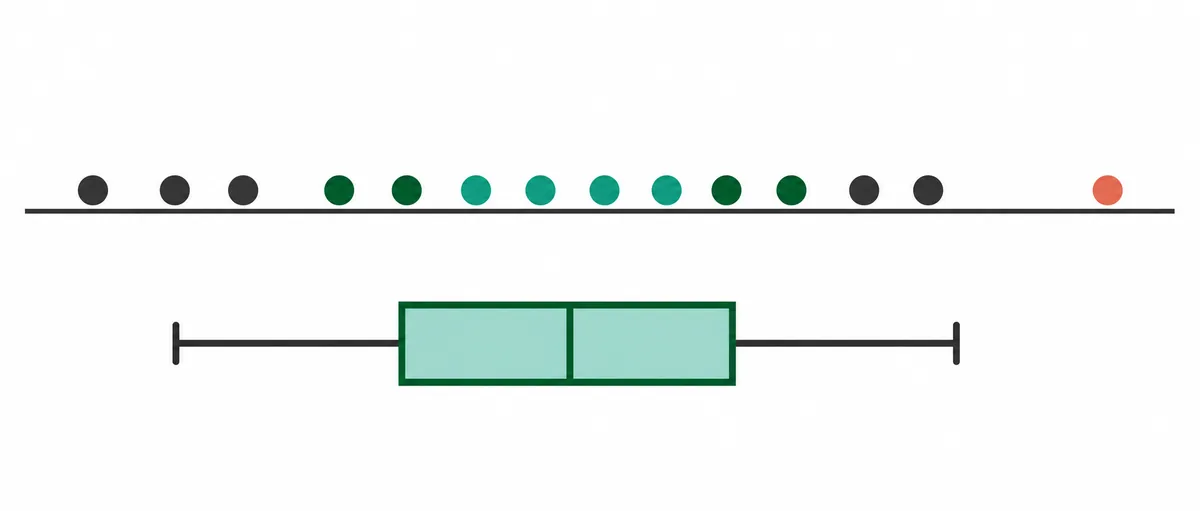
Quick answer: IQR = Q3 − Q1
Q1 is the lower quartile, or 25th percentile; Q3 is the upper quartile, or 75th percentile. After finding both values, subtract Q1 from Q3. For example, if Q1 = 5 and Q3 = 13, then IQR = 13 − 5 = 8. That formula always subtracts Q1 from Q3; the convention affects the two inputs.
Interquartile range formula and the three quartiles
Quartiles divide ordered data into four parts. Q1 marks the point below which about one quarter of the observations fall. Q2 is the median, and Q3 marks the point below which about three quarters fall. The interquartile range measures the distance from Q1 to Q3, covering the central 50% of the observations.
IQR = Q3 − Q1
The interquartile range is a distance, not a percentage. If a data set records minutes, dollars, or test points, the IQR uses the same unit. It cannot be negative when Q1 and Q3 are calculated from the same ordered data set, because Q3 is at or above Q1. Use the formula only after checking that both quartiles came from the same ordered values.
Quartile values can be whole numbers or decimals. A decimal quartile is not an error: it may be the average of two middle values or an interpolated percentile, depending on the chosen method. The interquartile range formula does not change when a quartile is interpolated.
How to find the interquartile range: a worked example
Use this sorted set of ten observations: 2, 4, 5, 7, 8, 10, 12, 13, 18, 40. This example uses the median-of-halves method, which separates an even-sized data set into a lower half and an upper half.
- Check the order. The values are already arranged from smallest to largest. Sort first whenever the original data is unordered.
- Find the overall median, Q2. There are ten values, so average the fifth and sixth: (8 + 10) ÷ 2 = 9.
- Find Q1. The lower half is 2, 4, 5, 7, 8. Its middle value is 5, so Q1 = 5.
- Find Q3. The upper half is 10, 12, 13, 18, 40. Its middle value is 13, so Q3 = 13.
- Subtract. IQR = 13 − 5 = 8.
| Value | Meaning |
|---|---|
| Q1 = 5 | Lower quartile from the lower half |
| Q2 = 9 | Median of all ten values |
| Q3 = 13 | Upper quartile from the upper half |
| IQR = 8 | Width of the middle half, in the data set's original units |
The value 40 is far above the other observations, but it does not change Q1, Q2, or Q3 in this particular set compared with replacing 40 by 20. That illustrates why IQR is more resistant to an extreme endpoint than the range. It does not mean every outlier leaves the IQR unchanged. The interquartile range formula applies to the selected quartiles; it does not require a different step for even-sized data.
How to calculate IQR with an odd number of values
For an odd-sized set, the median is one observed value. With the median-of-halves method, set that center value aside before finding Q1 and Q3. For 1, 3, 4, 6, 8, 9, 11, the median is 6. The lower half is 1, 3, 4, so Q1 = 3. The upper half is 8, 9, 11, so Q3 = 9. Therefore IQR = 9 − 3 = 6.
Some inclusive conventions include the overall median in both halves instead. That can produce different quartiles, especially with a small sample. State the convention when the exact result needs to be reproduced. The interquartile range formula remains Q3 minus Q1 for an odd sample.
Why Excel and statistics software can give different IQR values
The subtraction is always Q3 minus Q1, but there is more than one way to locate a quartile between observed values. Common approaches include the median of the lower and upper halves, percentile interpolation, and software-specific quantile definitions. A small data set can therefore have more than one defensible IQR. The interquartile range formula stays the same when tools use different methods; only Q1 or Q3 may change.
For an odd sample, a median-exclusive method leaves the central observation out of both halves. An inclusive method can use the median in each half. Spreadsheet functions also make their convention explicit: Excel provides QUARTILE.INC and QUARTILE.EXC. R's default quantile convention and the legacy Excel inclusive function use an interpolated definition; other choices may differ. Compare methods only after checking which definition each tool uses.
Do not silently switch conventions to make two answers match. If you are matching a class exercise, follow the stated textbook rule. For a report or reproducible analysis, record the software, function, and method. A methods note is especially useful when the sample is small or the quartiles are close to the ends of the data.
The CASRAI IQR guide compares common software conventions and explains why the method should be reported. Scribbr's worked examples also show how inclusive and exclusive approaches can change a result.
How to use the 1.5 × IQR rule to flag potential outliers
A common box-plot rule uses the interquartile range to set two fences. Apply the same formula after the chosen method gives Q1 and Q3:
Lower fence = Q1 − 1.5 × IQR
Upper fence = Q3 + 1.5 × IQR
For the ten-value example, Q1 = 5 and IQR = 8. The lower fence is 5 − (1.5 × 8) = −7; the upper fence is 13 + (1.5 × 8) = 25. The value 40 lies above 25, so the rule flags it for review.
A flag is a prompt to investigate, not a verdict that a value is wrong. Check the source record, measurement process, units, and context. A high but valid observation may be important. Removing it changes the data and should have a documented reason. The rule also cannot tell you whether an unusual value is caused by an error, a rare event, or a real feature of a skewed population. See Khan Academy's explanation of the IQR outlier rule for another visual treatment.
Box-plot whiskers are often drawn to the most extreme observations that remain inside the fences, with flagged observations shown separately. They do not always extend to the minimum and maximum. Follow the chart's legend or software definition when reading a specific plot.
IQR vs. range vs. standard deviation
These measures describe spread in different ways. Choose based on the question and the distribution, rather than treating one statistic as universally best.
| Measure | What it summarizes | What to keep in mind |
|---|---|---|
| Range | Maximum minus minimum | Uses only the two endpoints, so one extreme value can change it substantially. |
| Interquartile range | Q3 minus Q1; the middle 50% | Less sensitive to endpoint extremes, but does not describe every observation. |
| Standard deviation | Typical distance around the mean, under a defined population or sample formula | Uses all values and is more affected by extreme deviations. |
For skewed data or a set with extreme values, the median and interquartile range can be a useful pair. For roughly symmetric data where deviations from the mean matter, the mean and standard deviation may be more informative. The formula makes this measure a summary of middle spread rather than of the full range. The site's coefficient of variation guide explains one comparison based on relative spread; its variance formula guide covers squared deviations. If you need a standard deviation result, use the standard deviation calculator.
Interquartile range formula in Excel
If the observations are in cells A2 through A11, use the interquartile range formula with the same quartile function at each end:
=QUARTILE.INC(A2:A11,3)-QUARTILE.INC(A2:A11,1)
For the exclusive option, use QUARTILE.EXC in both parts of the subtraction. The formula must use the same function and data range for Q1 and Q3. This formula is easy to audit because Q3 and Q1 appear in the same expression. Do not mix an inclusive Q1 with an exclusive Q3. If you copy results into a report, include the chosen function so someone else can reproduce them.
Before trusting a spreadsheet result, confirm that the range contains numeric observations only, includes the intended rows, and does not accidentally include a header or omit a final value. Blank cells and text entries may be treated differently by different tools.
A short checklist for reporting the interquartile range
- Sort the observations and confirm the sample size.
- Name the quartile convention or software function.
- Report Q1, Q3, and IQR, with the original measurement unit.
- If you apply 1.5 × IQR fences, describe values as flagged for review rather than automatically invalid.
- Pair the IQR with a suitable center, often the median, when summarizing skewed data.
The semi-interquartile range, also called the quartile deviation, is half the IQR. It is useful when a question specifically asks for a half-spread measure, but it is not a substitute for stating the full IQR when that is the requested statistic.
Frequently asked questions
What is the interquartile range formula?
IQR = Q3 − Q1. Find the third quartile, find the first quartile using a stated convention, and subtract the first from the third. This formula has two parts: identify the quartiles under one stated convention, then subtract.
What does the IQR tell you?
It describes the width of the central half of an ordered data set. It is a measure of spread, not a count of observations or a measure of the mean.
Why does my calculator show a different IQR?
It may use a different percentile interpolation or median-inclusion rule. Check whether the tool uses an inclusive, exclusive, or median-of-halves convention and compare Q1 and Q3 separately.
Is an observation outside an IQR fence an error?
No. It is unusual under the selected rule and deserves a context check. The fence alone does not justify deleting a valid observation.
How do you find the semi-interquartile range?
Divide the IQR by two. If Q1 = 5 and Q3 = 13, the IQR is 8 and the semi-interquartile range is 4.